Managing a Database on pgEdge Cloud
Highlight a database name in the navigation tree to display detailed database information in the pgEdge console.
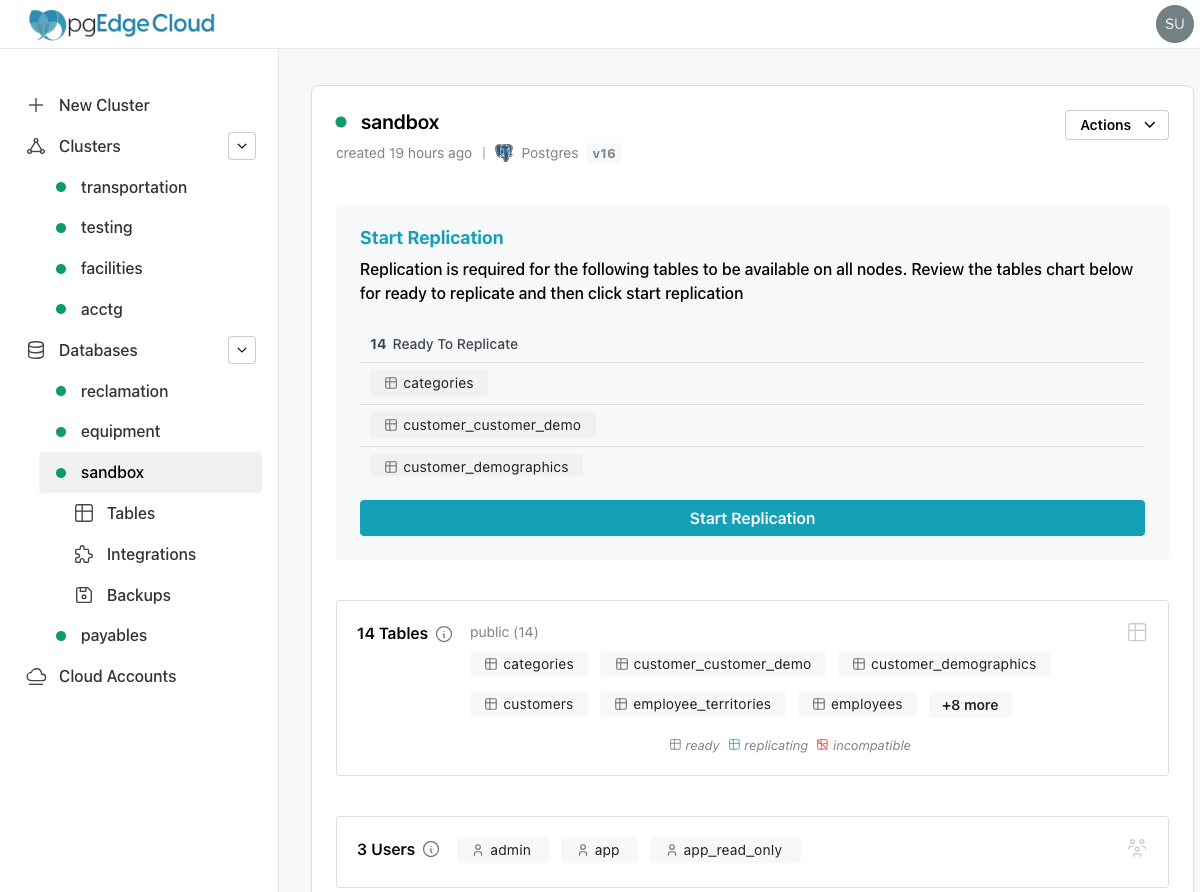
Console content is displayed in a series of panes that simplify database management; select a pane to review information or perform management tasks.
The Console Header

The console header tells you:
-
The name of the database; next to the name, a dot indicates the status of the database:
- A green dot indicates that the database is available for connections.
- A blue dot indicates that the database is being created.
- A red dot indicates that the database is not available.
-
How long the database has been running.
-
The version of PostgreSQL database deployed.
On the right-side of the console header, you'll find the Actions drop-down menu. Use the Delete Database menu option to delete the currently selected database.
The Get Started Pane
If you did not install the sample database (creating tables), the console displays the Get Started pane at the top. The pane displays a PSQL connection string that you can use to connect to the database as the admin user (a database superuser).
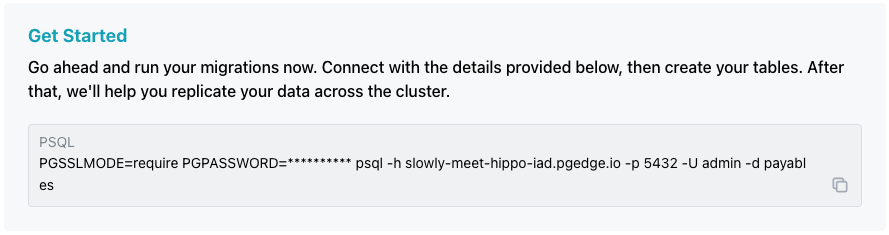
For detailed information about:
- installing the psql client and connecting to the database, see Connecting.
- moving a database object into your database, see Migration.
- PostgreSQL SQL commands, see the PostgreSQL documentation (opens in a new tab).
The Start Replication Pane
If you installed the sample Northwind tables, the database console opens with the Start Replication pane displaying the sample tables that are ready to replicate.
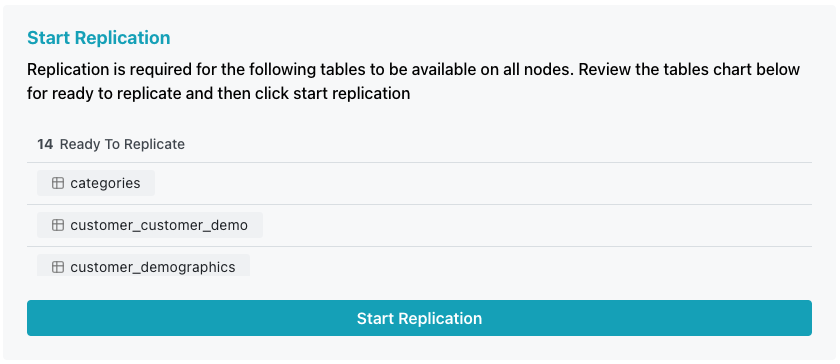
Press the Start Replication bar to start replication for the sample objects listed above the bar.
The Tables Pane
Below the Start Replication bar, the Tables pane displays the schema name (public) and names of the sample tables. The pane displays the names of tables added with a PostgreSQL client as well.
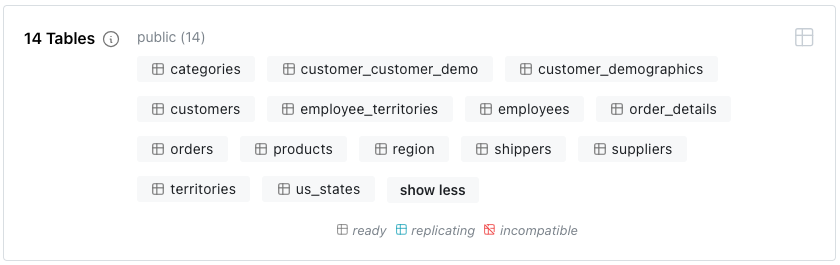
An icon to the left of the table name indicates the state of each table:
- A grey icon indicates that the table is ready for replication.
- A blue icon indicates that the table is currently replicating.
- A red icon indicates that the table cannot be replicated. To be replicated, a table must have a primary key.
Double-click a table name to open the table viewer, displaying the contents of the table.
The Users Pane

In its initial state, a new database has three Users:
- The
adminuser is a database superuser. Use this identity for your first login; the password is included in thePSQLconnection string on the console. - The
appuser is a login user without superuser privileges. - The
app_read_onlyuser is a login user without privileges to make changes to the database.
You can use psql or pgAdmin to create additional database users (opens in a new tab); remember the principal of least privileges (opens in a new tab) as you share database login access.
Connect to your database
If your database contains tables (either from the sample schema or user-created), the Connect to your database pane displays connection information for the three nodes in your cluster. Select a node (Nearest, n1, n2, or n3) and user name to access connection details for a specific node/user pair.
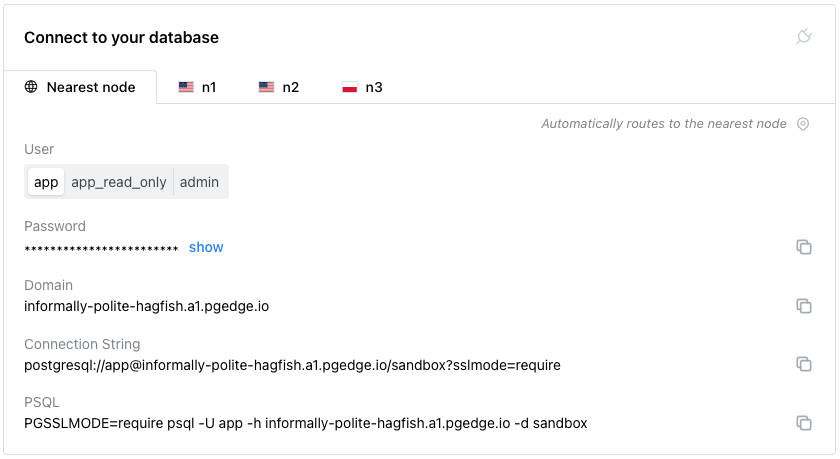
For detailed information about using the connection information to connect to your database, see Connecting.
The Code Snippets Pane
The Code Snippets pane displays three code snippets (TypeScript, Python, and Go) that set the environment variables for your cluster and create a cursor that lists the nodes in your cluster.
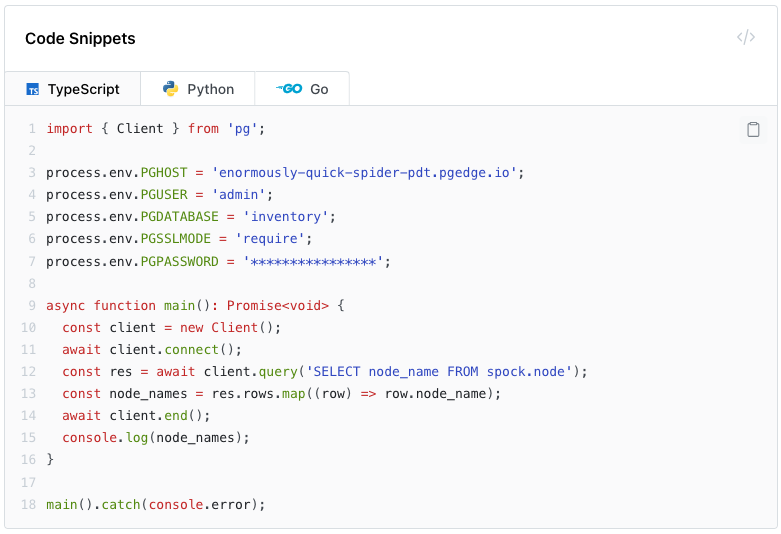
Consider the snippets a starting point for the application developers on your team.
The Cluster Map
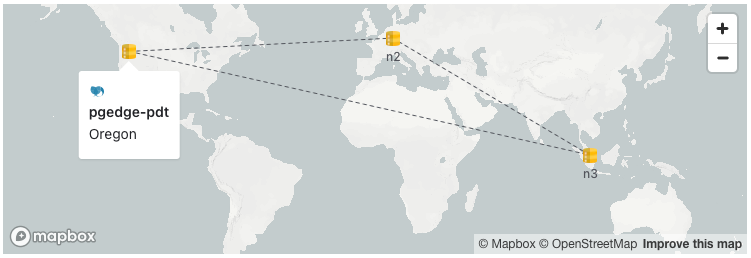
A map in the pgEdge console displays the nodes in your distributed replication cluster; hover over a node to display the region name and location.
The Usage Pane
If you are using Developer Edition, the Usage pane displays a bar graph showing how much space you have used and available in your cluster. If you are using Enterprise Edition, database resources are limited only by the size of your underlying nodes (virtual machines).

Node Metrics
The Node Metrics section of the console displays an overview of the resources used by the cluster in the last hour. Tabs across the top of the section allow you to display the metrics for the entire cluster or select the metrics for an individual node.
The All nodes tab shows bar graphs that compare resource usage for all three nodes of your cluster.
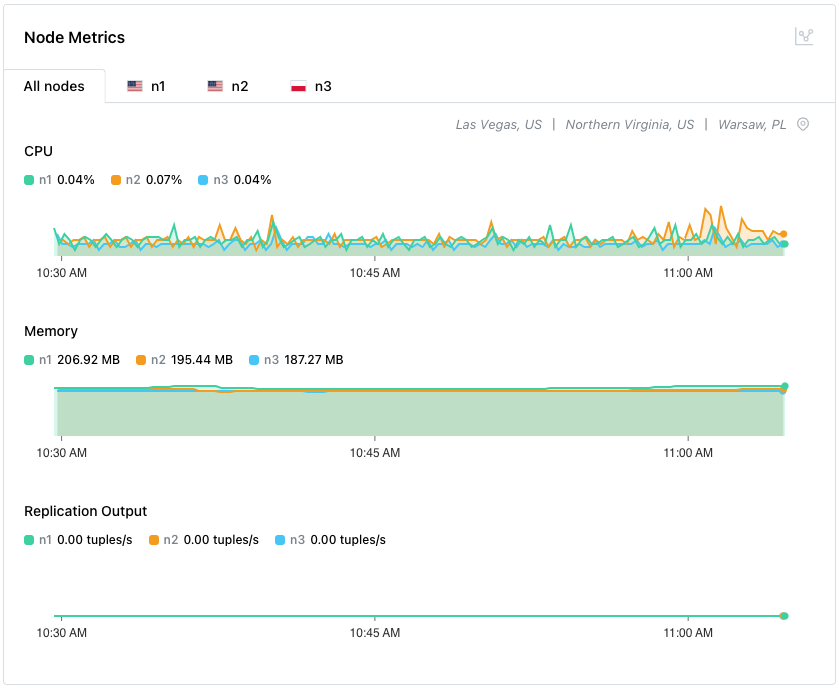
Detailed usage is color coded; select a tab to display details about resource usage on a specific node. Select a point in each graph to return a detailed metric for a specific node at a specific point in time.
| Command | Description |
|---|---|
CPU | The CPU graph displays information about the CPU usage for the server. |
Memory | The Memory graph displays information about memory usage (in MB) for the cluster or by the node. |
Replication Output | The Replication Output graph displays the replication traffic for the database in tuples. |