Managing a Cluster
You can use the pgEdge Cloud console to review cluster information; highlight the name of a cluster in the Clusters menu to access the console for that cluster.
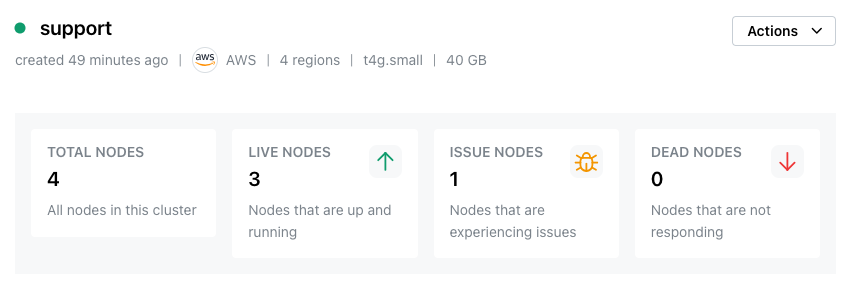
The console header displays information about the selected cluster:
- the console name
- the length of time since console creation
- the name of the cloud provider
- the number of regions that host nodes
- the instance type and size of each node
Also in the cluster header, a set of informational panes tell you the state of the cluster at a glance:
- the total node count
- the number of healthy nodes
- the number of unhealthy nodes
- the number of unresponsive nodes
Use the drop-down menu in the upper-right corner to delete a cluster.
Use the lower section of the console window to access detailed information about each node.
The Nodes Tab
Select the Nodes tab to display and copy node and connection details for each node in the cluster. To display a pane for each node in the cluster, choose the All Nodes display option; to view information for a specific cluster node, choose the cluster name/location combination in the tab browser.
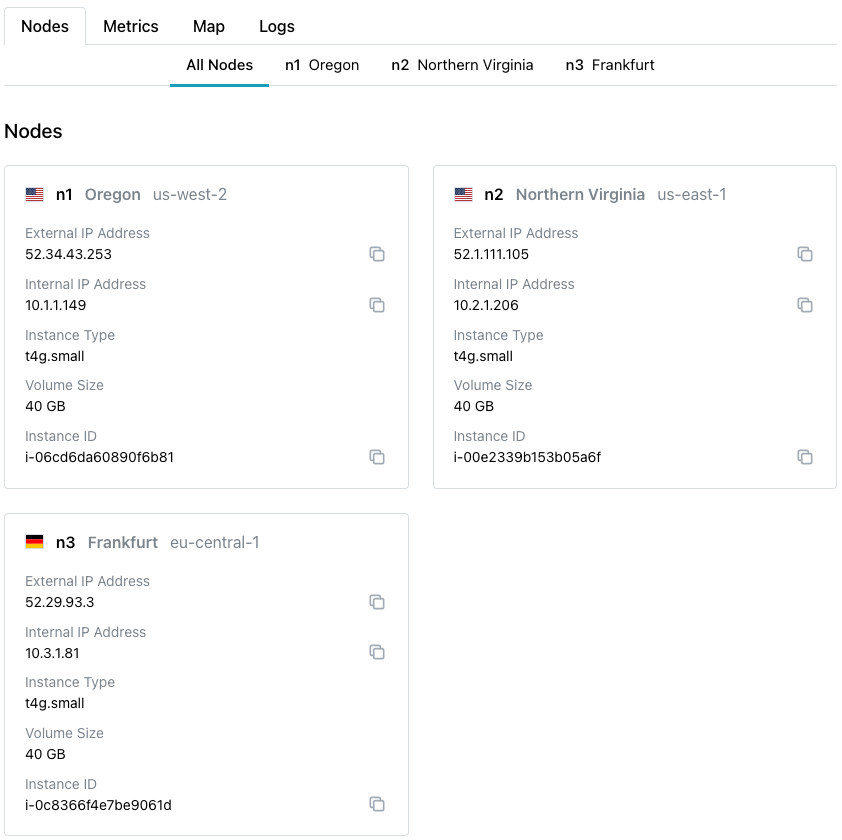
The Node Information pane contains general node information:
- Use the
External IP Addresswhen making ssh connections to the node. - Use the
Internal IP Addresswhen configuring VPN connections to the node. - The
Instance TypeandVolume Sizeprovide node size information. - Use the
Instance IDto identify the node and associated resources in the cloud provider console.
The Metrics Tab
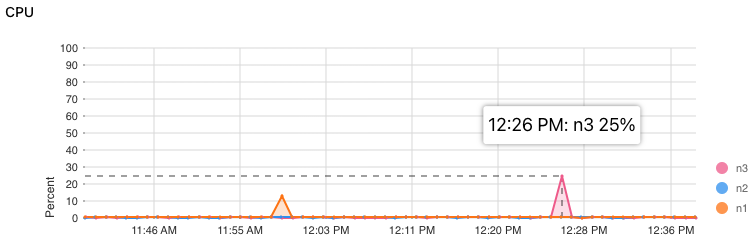
Select the Metrics tab to display graphed metrics for the cluster. To display a graph that compares information for all of the nodes in the cluster, choose the All Nodes display option. To graph information for a single cluster node, choose the cluster name/location combination in the tab browser.
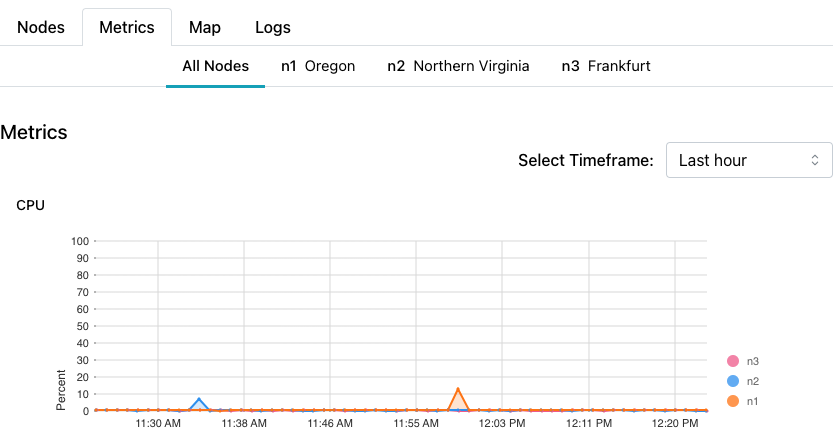
The graphs display usage statistics for each node in the cluster:
- The
CPUgraph displays the percentage of CPU usage. - The
Memorygraph displays the percentage of Memory usage. - The
Diskgraph displays the amount of disk used(in GB). - The
Processesgraph displays a count of the number of processes used. - The
Network Receivegraph displays the time used by inbound processes (in Kb). - The
Network Sendgraph displays the time used by outbound processes (in Kb).
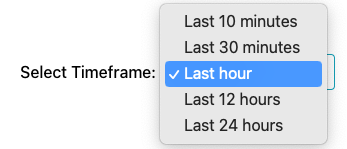
Each node in the cluster is represented by a different color of line in the graph. Use the Select Timeframe drop-down to select the amount of time that is represented in the Metrics graphs.
Position the selection bar to display detailed metrics for a specific point in time.
The Map Tab
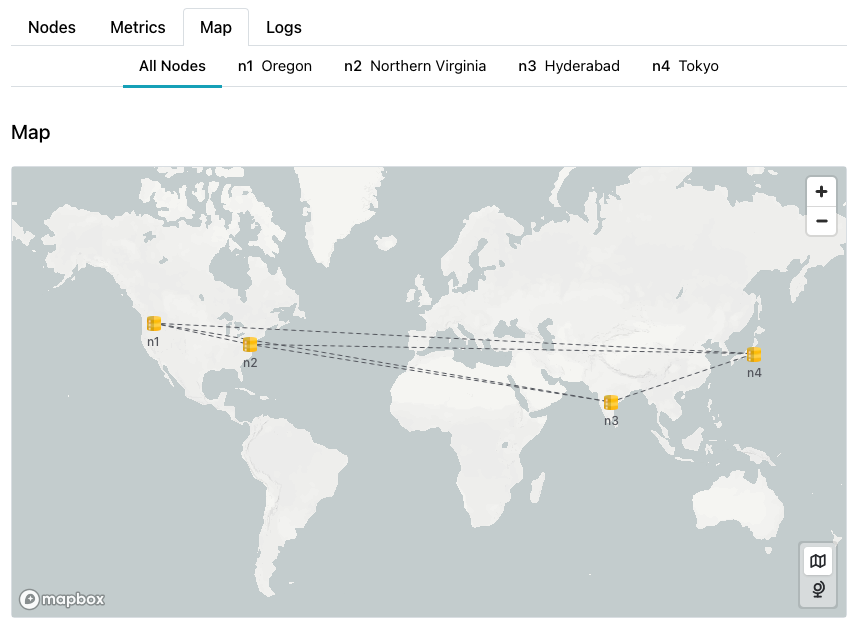
Select the Map tab to display a map that shows the location of the cluster's nodes. To display a map that compares the locations of all of the nodes in the cluster, choose the All Nodes display option. To show a map displaying a single cluster node, choose the cluster name/location combination in the tab browser.
Hover over a mapped node to display the name and city in which the node resides.
The Logs Tab
Select the Logs tab to display logging activity for the cluster. To display the log files for all of the nodes in the cluster, choose the All Nodes display option. To display the log files for a single specific cluster node, choose the node name/location combination in the tab browser.
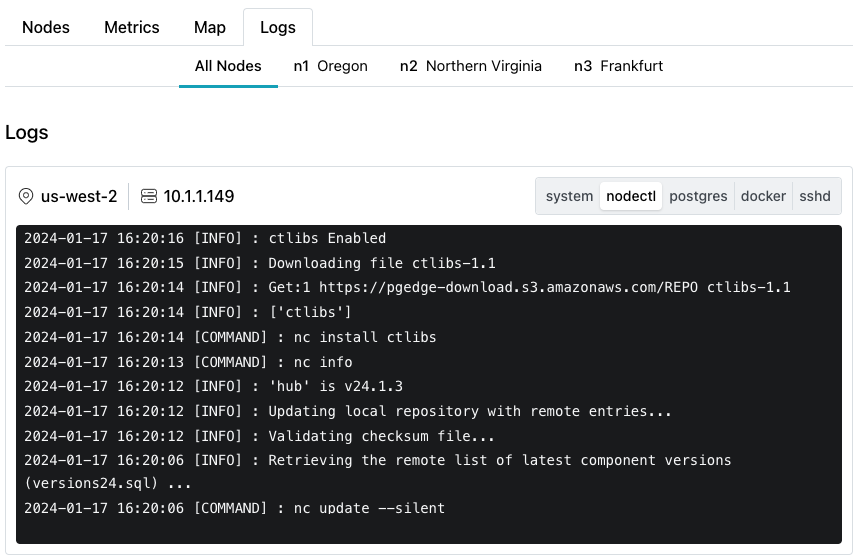
You can use the Logs tab to access log file entries for your nodes:
-
The
systemlog displays system calls used to create and manage the nodes on your system. -
The
nodectllog displays the pgEdge management commands invoked while creating and managing the cluster. For detailed information about pgEdge commands, see the documentation for pgEdge Platform. -
The
postgreslog displays user commands invoked against the PostgreSQL server (opens in a new tab) that resides on the node. -
The
dockerlog displays the commands that manage the Docker containers used by your deployment. -
The
sshdlog displays the log files for the SSH daemon monitoring your nodes for connections.
pgEdge Resources
Use the links in the lower-left corner of the pgEdge Cloud console to access pgEdge resources:
- For an invitation to the pgEdge Discord server, select the
Communitylink. - To review the documentation, select the
Docslink.